


4 Reasons Why R is My Favorite Tool for Nearly Any Problem

The First Question, Of Course: Why R?
Let me give you the punchline up front: the ultimate answer is, because I know it the best. Before that turns you away, hear me out: I’ve also competently used Stata, Python, SQL, and Excel, and I still find myself reaching for R whenever possible.
R was designed primarily for statistics (so if you’re working with data, it should be at the top of your list), but it can also handle tasks often associated with other programming languages like machine learning and even building web apps. Where R truly shines, however, is in making your workflow more reproducible and your programming more readable (to humans). Tools like Quarto allow you to integrate R code into documents, websites, and web apps effortlessly, making your work both transparent and presentable.1
I should also emphasize that my background is in economics, not computer science or software engineering. So my perspective is aimed at those who want an approachable entry point into data science or computing—not a deep dive into software engineering frameworks or complex programming concepts.
You Start with What You Know
When it comes to data analysis, most people begin with the tools they’re familiar with—not necessarily the ones they need. For example, if I asked you to calculate the simple average of five numbers, you’d probably grab a calculator app. That’s what I’d do, too!
But what if I handed you a spreadsheet with thousands of rows and hundreds of variables and asked you to make a bar chart or analyze trends over time? Most people might turn to Excel—it’s familiar and accessible. I was the same way, even as recently as five years ago.
However, once your datasets grow large or your analyses become more complex, Excel starts to feel clunky and inefficient. Not to mention, spreadsheets are deceptive because your actions are not documented for others (including your future self) to understand or replicate!
That’s where R enters the picture.
The Great Statistical Software Wars
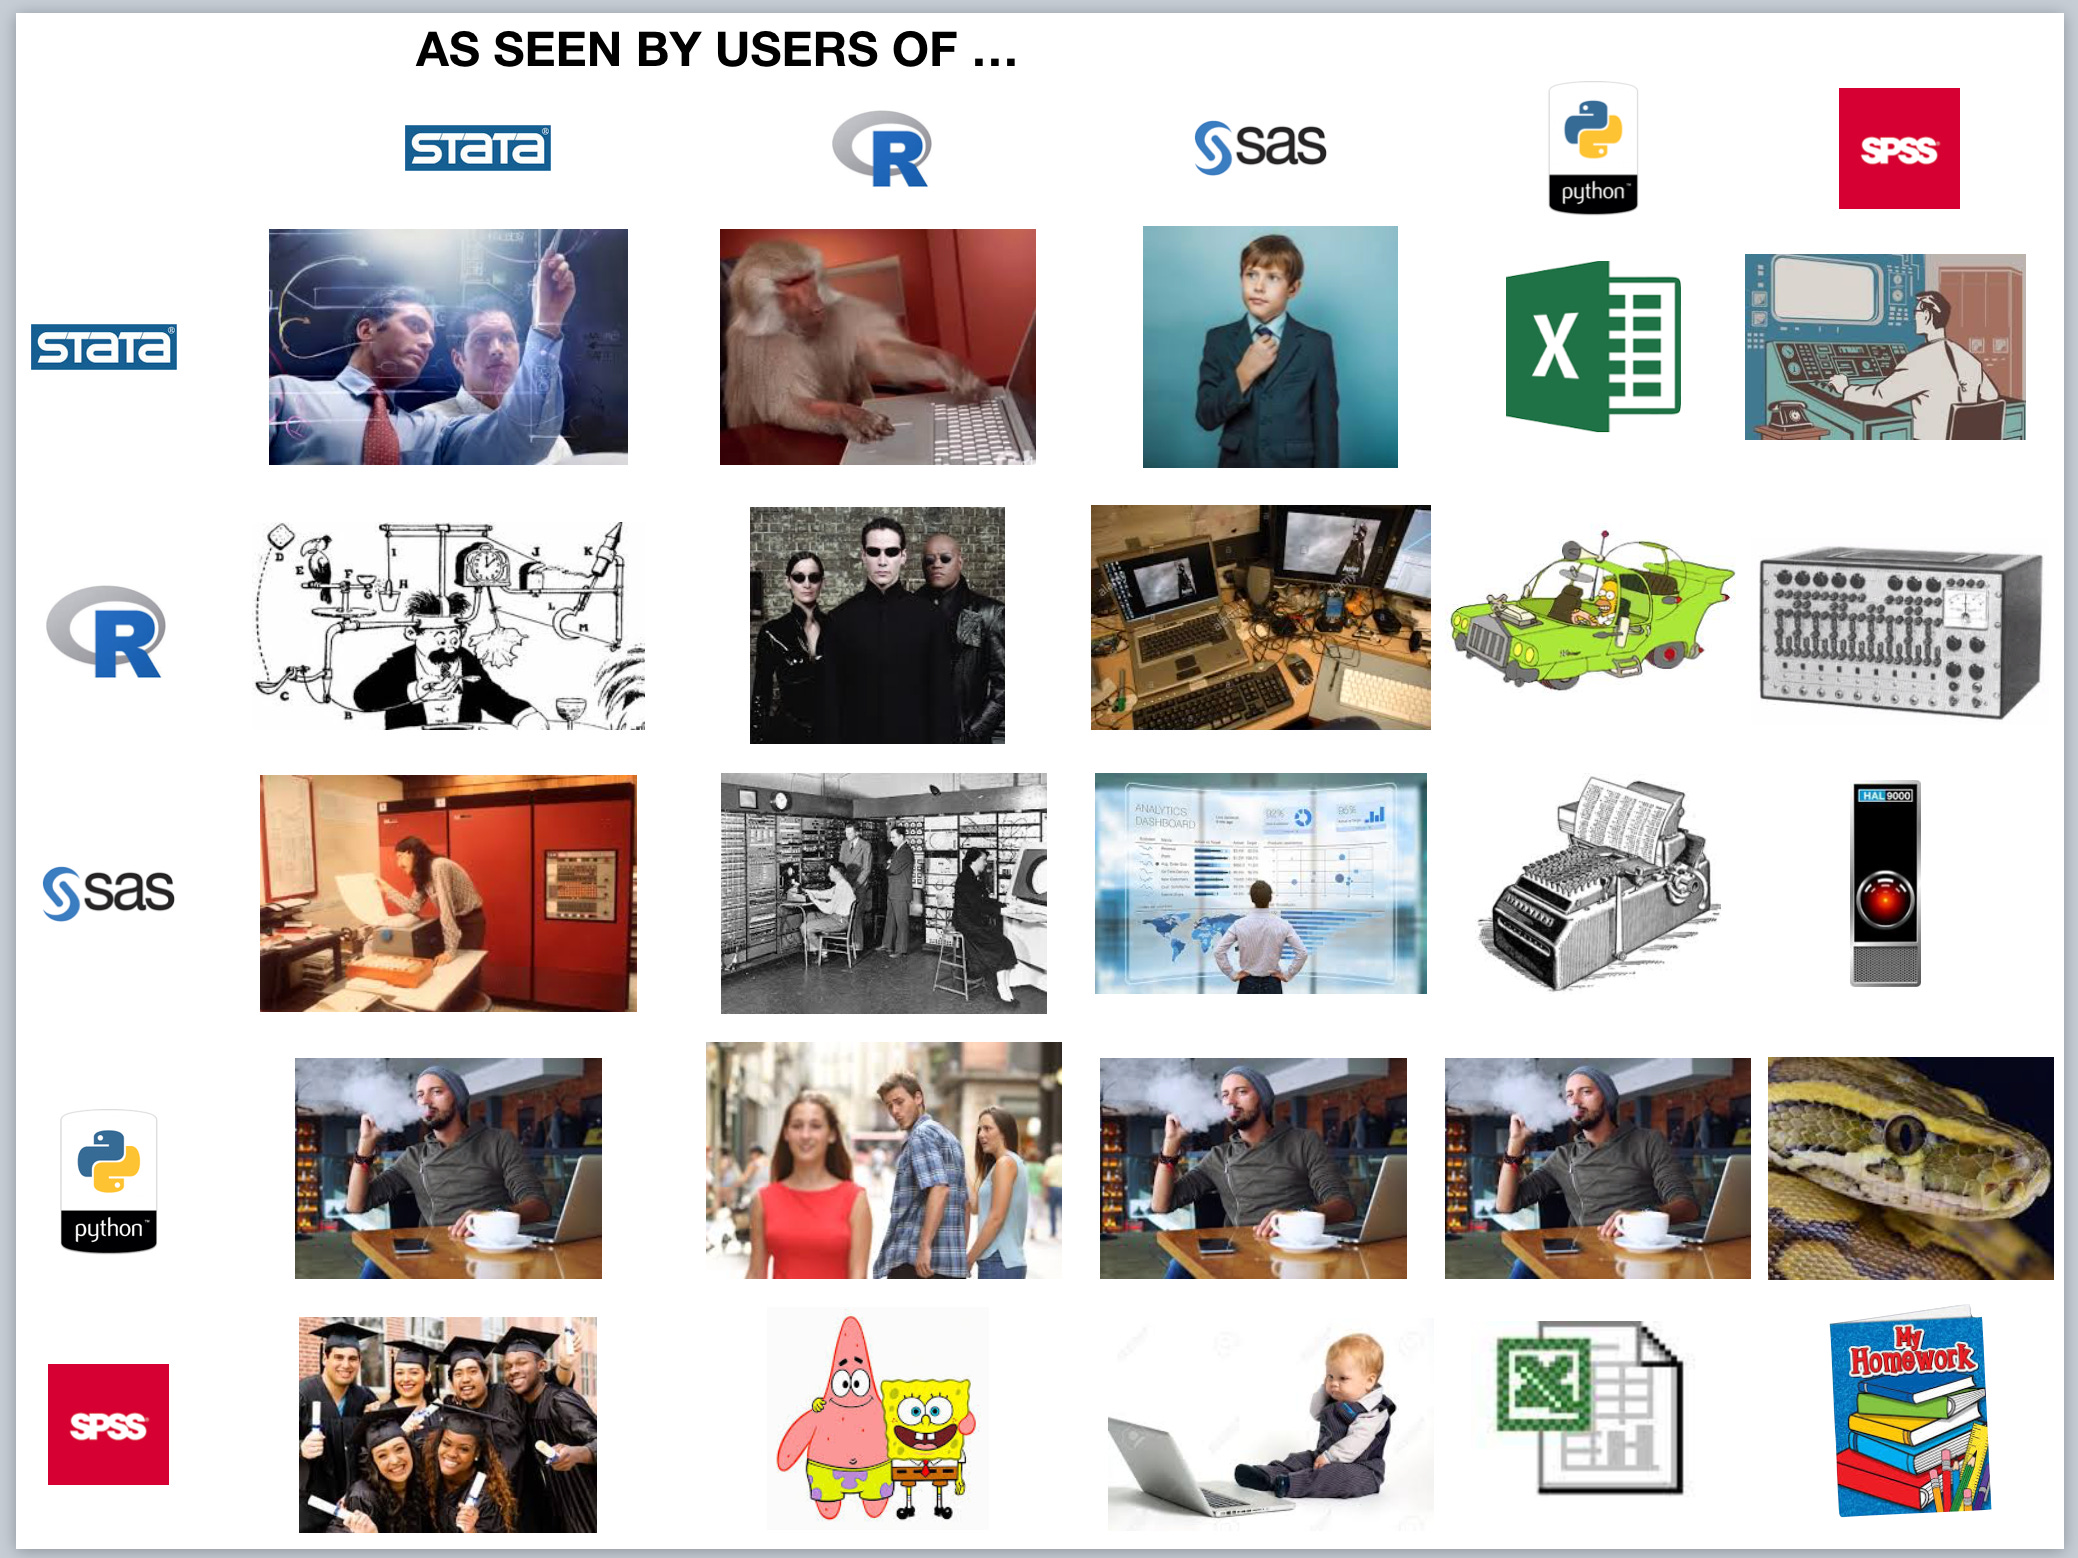
It can be fun to wade into debates about which statistical software reigns supreme, and I’ll admit I can’t resist sharing one of my favorite memes on the topic:
But in the end, it’s not that productive to wage an evangelical battle over mere tools. What really matters is find a language (or set of tools) that lets you accomplish your goals efficiently. This brings me to a famous diagram summarizing the core tasks of data science:
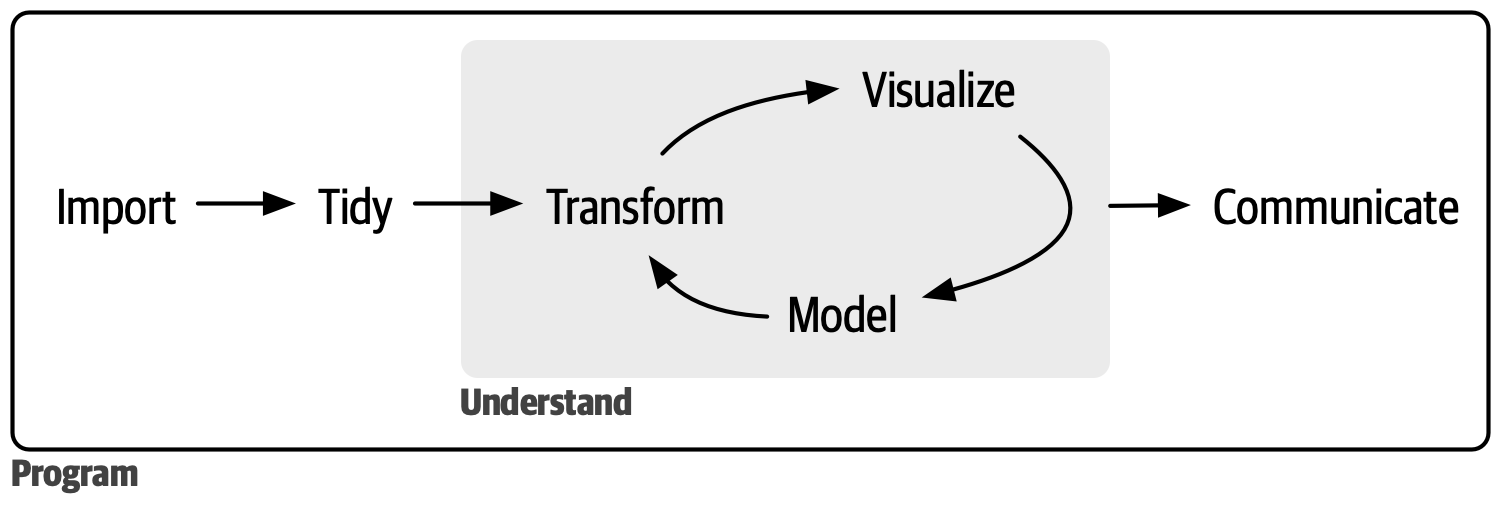
For me, R (and Quarto) can handle all of these tasks seamlessly. I won’t dwell too much here on why NOT to use Stata or Python—that’s a topic for another day. Instead, let me share four reasons why I love R and recommend giving it a try.
1. R is Free & Open Source Software
One of R’s best features is that it’s completely free and open source. This means a few things, most obviously that that you don’t need to pay for expensive licenses and there are no proprietary restrictions on your files or code. You can use it on any operating system, and there are no limits on the size of your datasets (unlike certain Stata licenses, for example).
Being open source also means R has a massive, active community of users who create packages for specialized tasks and provide excellent support. The R community is extremely friendly, supportive, and helpful in providing tutorials, documentation, and troubleshooting. I have learned a tremendous amount from other R users and people who freely share their knowledge on the internet - this is merely my turn to make my own small contribution.
From this multiplicity of packages comes a common refrain about R that rings true:
The best thing about R is that there is more than one way to do something. The worst thing about R is that there is more than one way to do something.
2. R Has the tidyverse
This brings us to, in my opinion, one of the game-changing features of R: the tidyverse:
The tidyverse is an opinionated collection of R packages designed for data science. All packages share an underlying design philosophy, grammar, and data structures.
Among many other features, the tidyverse makes data analysis and R code much more accessible to human readers. Compare these two approaches to finding the average highway miles per gallon for Audi cars in the mpg dataset:
# Version 1: Base R

audi_data <- mpg[mpg$manufacturer == "audi", ]
hwy_avg <- aggregate(hwy ~ model, data = audi_data, FUN = mean)
print(hwy_avg)
# Version 2: tidyverse
mpg |>
filter(manufacturer == "audi") |>
group_by(model) |>
summarize(hwy_avg = mean(hwy))Both code snippets will produce the results in tabular format, like below:
  model      hwy_avg
1 a4            28.3
2 a4 quattro    25.8
3 a6 quattro    24
The tidyverse version is far easier to read and understand—especially if you’re new to coding.
I am merely scratching the surface here, since the unified grammar and design of functions and objects (and the concept of “tidy” data) are a big innovation in how we do data analysis.2
The tidyverse philosophy has made an impact beyond just R: some recent Python packages like plotnine and polars have been developed to mimic core components of the tidyverse (ggplot2 and dplyr, respectively).
3. R is Very Flexible
The rich ecosystem of packages that the R community has created makes R tremendously flexible. In addition to descriptive and inferential statistics, you can use R to do:
machine learning (tidymodels)
geospatial analysis (sf)
database queries (dbplyr)
web scraping (rvest)
Bayesian inference (brms)
agent-based modeling (abm)
data visualization (ggplot2)
interactive web applications (shiny)
website, document, and presentation creation (quarto)
Many of these tasks would otherwise require specialized knowledge of other languages like SQL, GIS, Python, Javascript, or NetLogo.3 If you’re staring down a problem, odds are that someone has made a package for it. In fact, there are probably several different packages for it!
4. R Integrates Seamlessly with Quarto
Quarto (formerly R Markdown) allows you to combine R code with text to create beautiful, reproducible documents, slides, websites, or even interactive dashboards. As I said in my introductory post, unless collaboration demands otherwise, nearly every digital artifact that I create these days is done in Quarto. It was one of my favorite discoveries of the last decade (other than R) that has totally reoriented my workflow. No more copy-pasting across multiple applications, no more editing multiple documents, figures, and slide decks when you need to change your analysis. It can all be done in one place - reproducibly.
Another awesome feature that R can connect to is Shiny - for producing high quality interactive web apps.4 One of my favorite things to do when teaching economics courses is to have students visualize relationships (often through a graph) and show how key parameters affect the outcome. Shiny apps let users modify inputs and watch as the output on the webpage changes dynamically in response. My webpage collects a number of shiny apps that I’ve made to demonstrate concepts.
Why R Works for Me
For me, R strikes the perfect balance of power, flexibility, and accessibility. It allows me to tackle a wide range of problems without needing to learn a dozen different tools. Combined with Quarto, I can make my work not only reproducible but also beautiful.
Whether you’re a seasoned data scientist or just starting out, I encourage you to give R a try. It might just become your favorite tool too.
However, note that this is changing as Posit, formerly R Studio is heavily pivoting to include support for Python and other languages like Julia.
Software engineers and “base R” purists may say that this is a bug rather than a feature: it leaves you not knowing the basics of how the language works and introduces a reliance on dependencies. These points are well-taken, but again, my emphasis here is to give you accessible tools that can deliver you quality results right now, rather than a complete, academic understanding.
Again, knowing these is great, and I would not discourage you from learning any of them if they help solve your problems. My point is that you can get pretty far just knowing R.
Due to its popularity, Shiny now also supports Python.